BehMon

Network monitoring

Monitoring that tells you before your users do

BehMon watches every device, link and service continuously, folds duplicate alerts into one incident, and only wakes the on-call phone when it really matters.

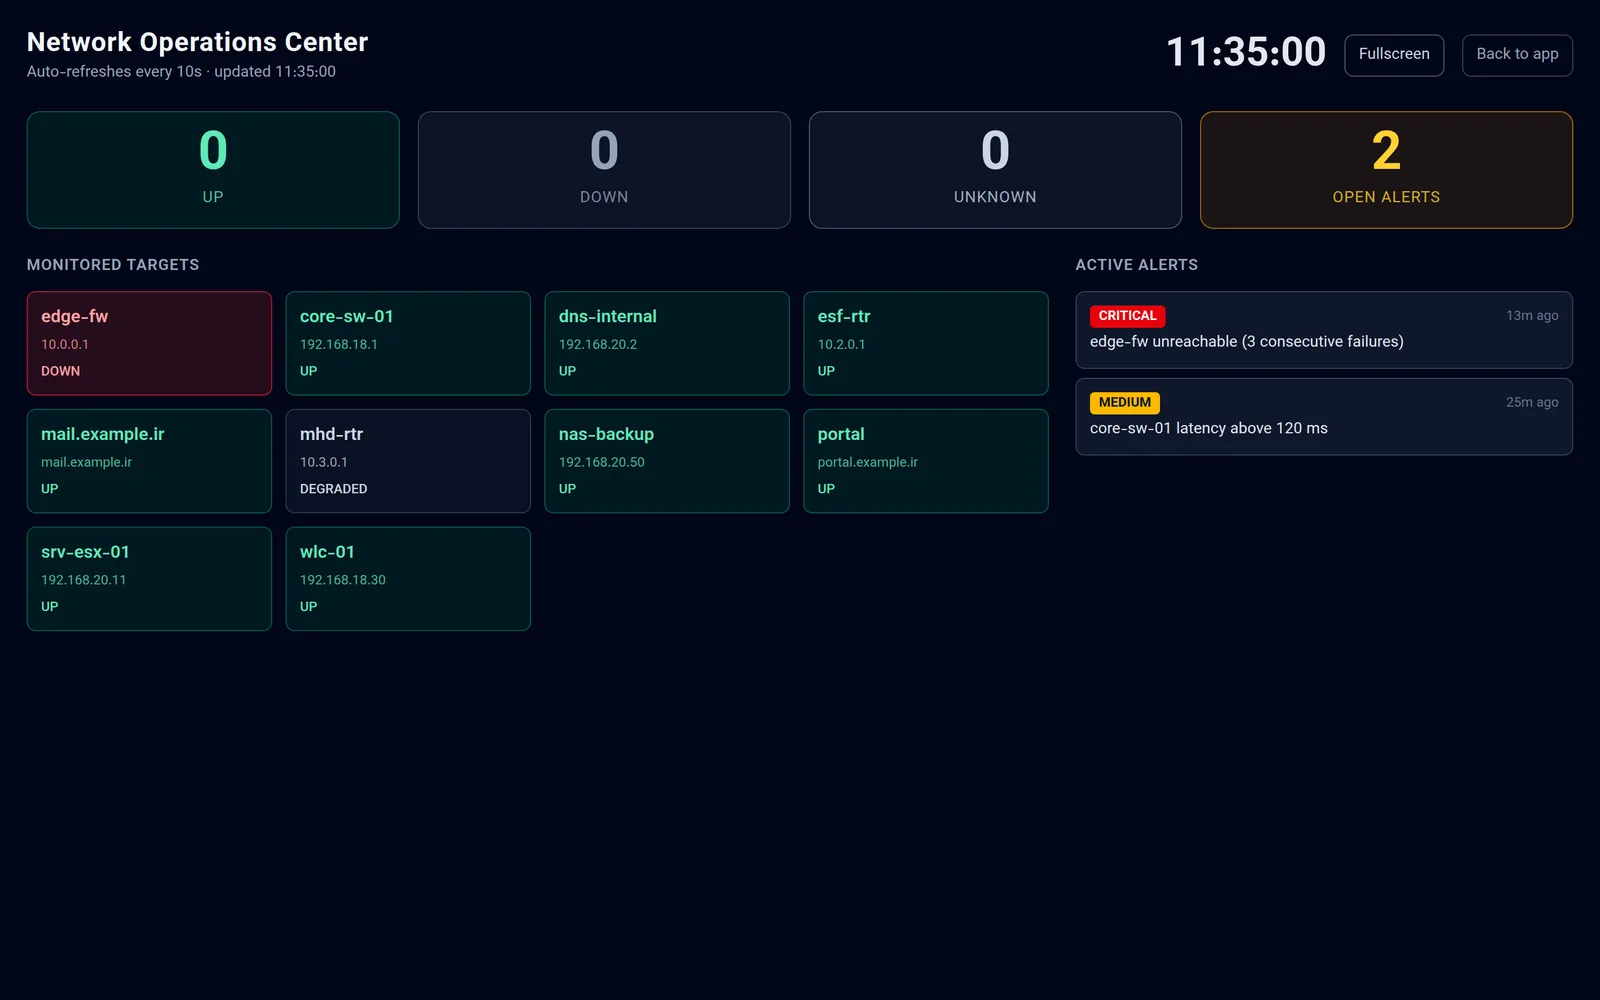
BehMon network operations centre view with target states and active alerts

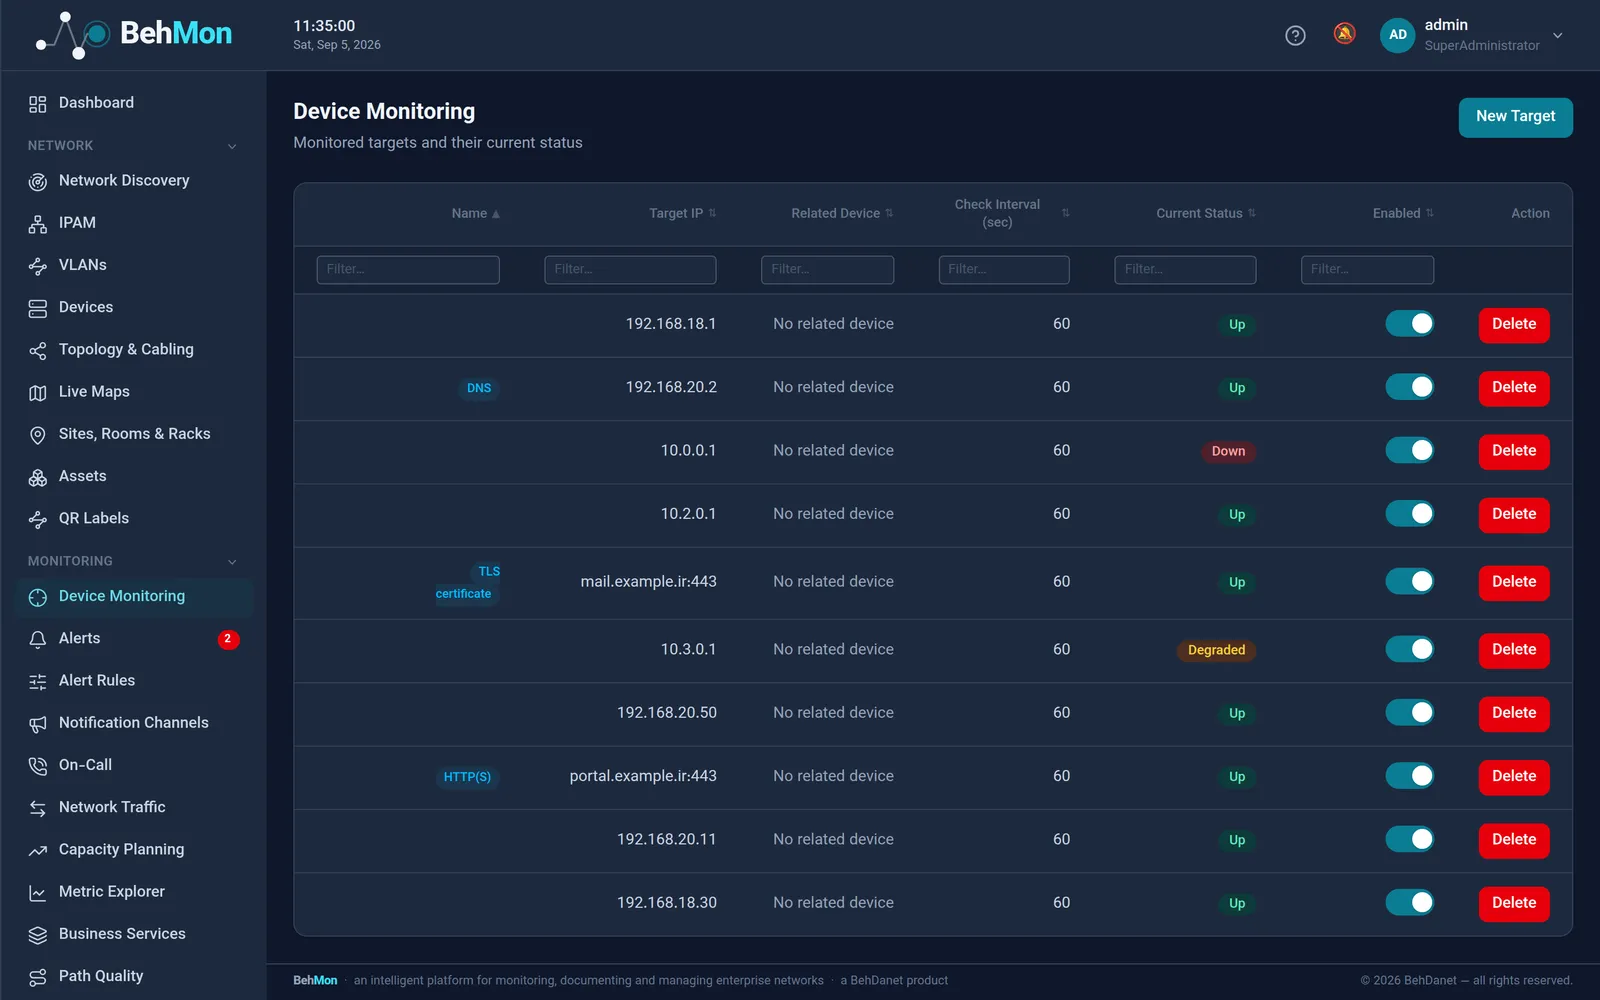
Layered checks, from ping to service

Every target is checked the way it should be, and every result feeds the same state machine, the same alerting and the same SLA report.

  • ICMP ping recording latency, jitter and loss — TCP as the fallback
  • HTTP/HTTPS status and keyword checks, DNS checks, TLS certificate expiry
  • SNMP v2c for uptime, interface traffic and custom sensors (any OID)
  • An SNMP walk browser in the panel to find the OIDs you need
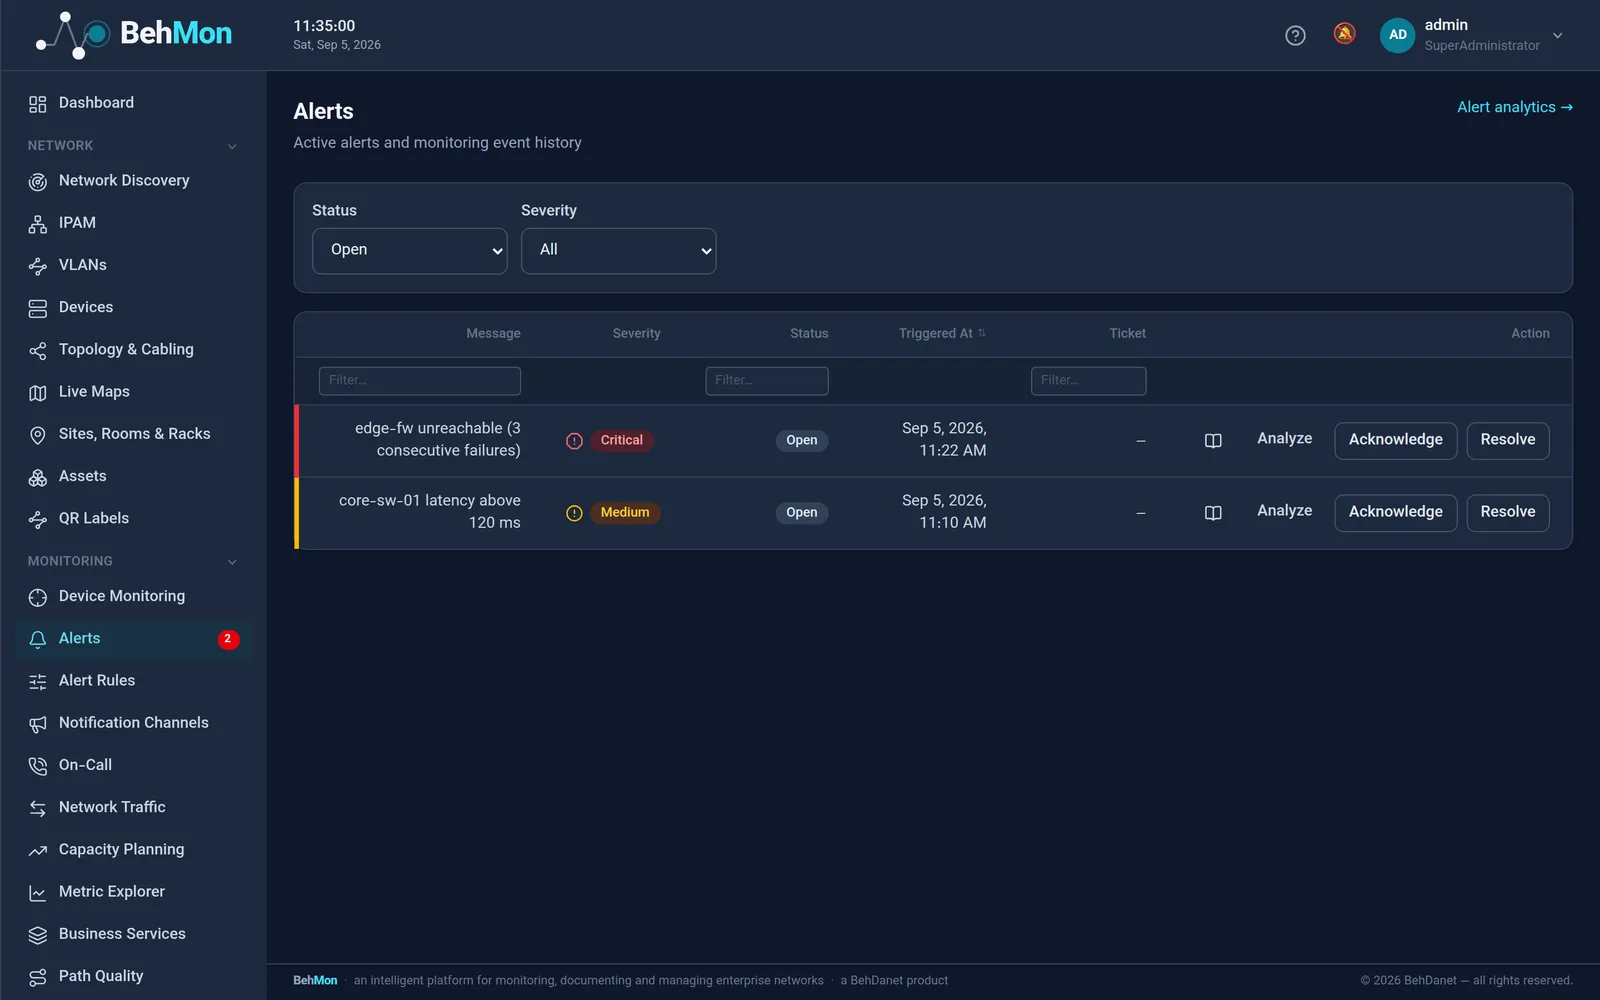
Smart alerting without alert fatigue

Most monitoring tools bury the team in duplicates. BehMon finds the root cause and quiets the rest.

  • Topology-aware correlation: devices behind a dead core switch don't page separately
  • Flap detection — one alert for a bouncing target
  • Anomaly detection against a seasonal baseline (same weekday, same hour)
  • Threshold suggestions computed from the metric's own history

Notifications where your team actually looks

Alerts go out with your own message templates, quiet hours and escalation.

  • Email, SMS (local providers), messengers, webhooks and syslog/CEF for your SIEM
  • Browser notifications and Web Push, even with the panel closed
  • Escalation for unacknowledged alerts, and on-call rotations
  • Recurring maintenance windows that silence alerts automatically

SLA, capacity and status pages

Turn the data monitoring already collects into planning and reporting.

  • Monthly SLA report with PDF/Excel export and scheduled delivery
  • Capacity forecasting: “this link saturates in about 45 days”
  • Business-service trees with rolled-up SLA
  • A public status page that never shows an IP address

Branches and servers

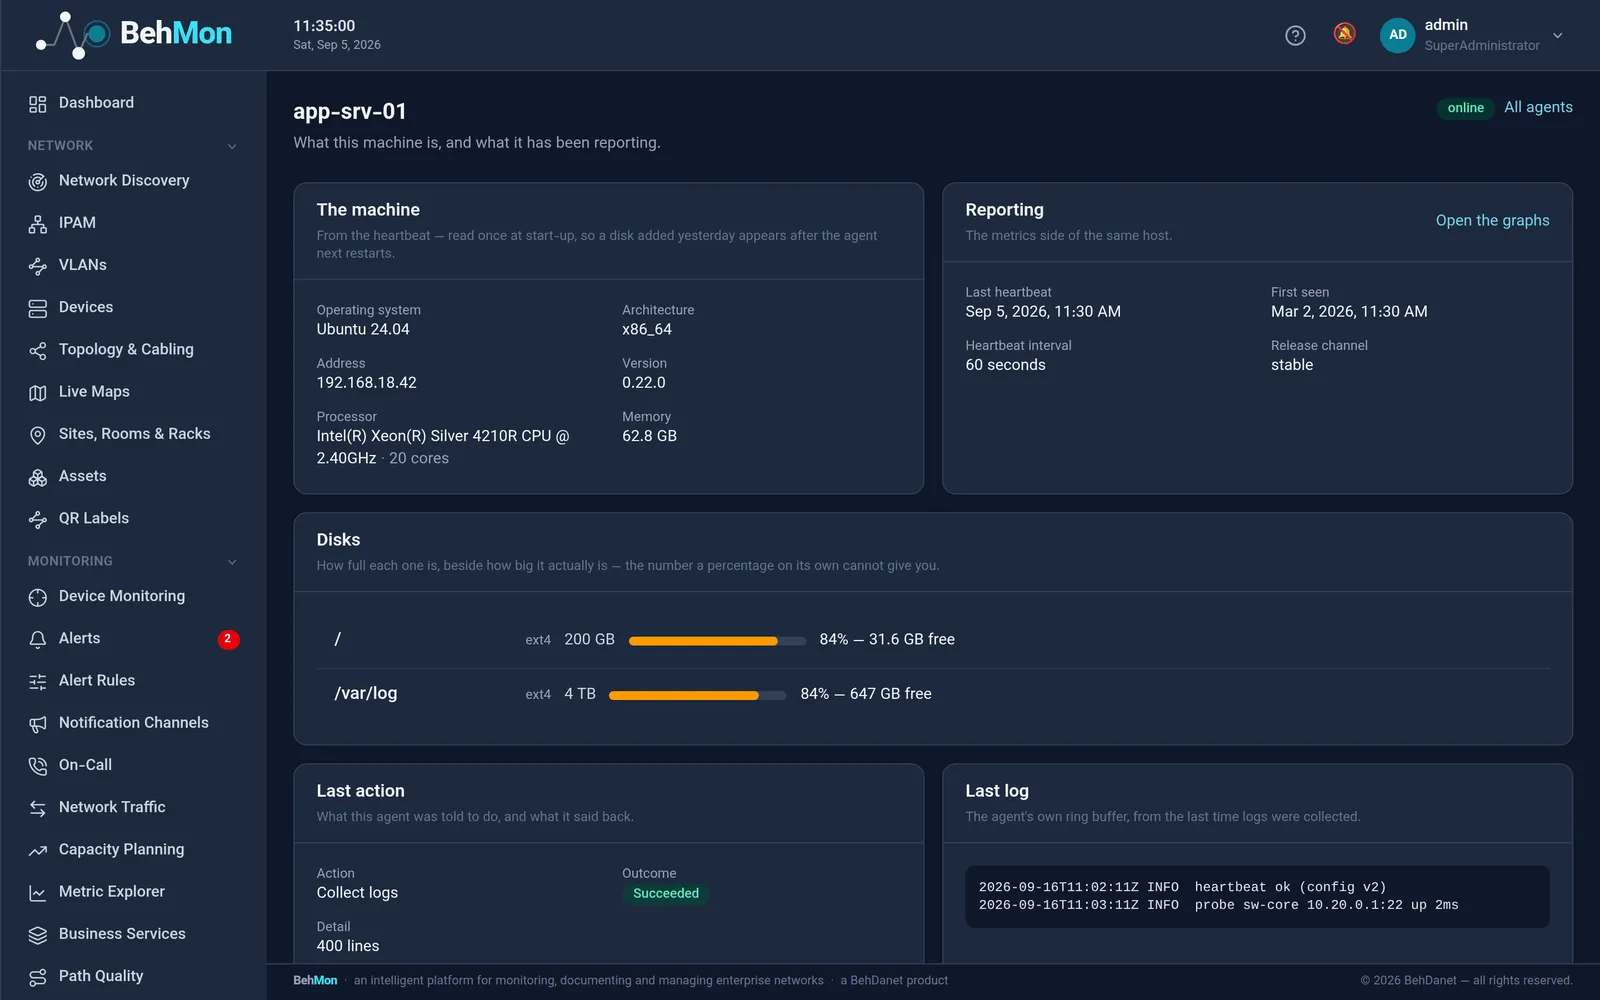
One small, dependency-free agent for Linux and Windows reports what a machine is and what it is doing, and probes from inside a branch.

  • CPU, memory, disk and uptime with nothing else to install
  • Hardware inventory in every heartbeat: CPU model and cores, total memory, and the size of every filesystem
  • Capacity forecasts with the size behind the percentage — “84% of 4 TB, 640 GB left” — per disk, not just the worst one
  • Collector mode: a branch agent runs its own checks and spools the results when the WAN is down, replaying them when it returns
  • Fleet management from the panel: an “outdated only” filter, signed auto-update, restart and log collection — no ssh

The right view for every role

The NOC, the field technician and the manager each get a view built for them.

  • Full-screen NOC wall with auto-refresh
  • Personal dashboards with drag-and-drop widgets
  • Mobile app (PWA) to acknowledge and resolve alerts on the go
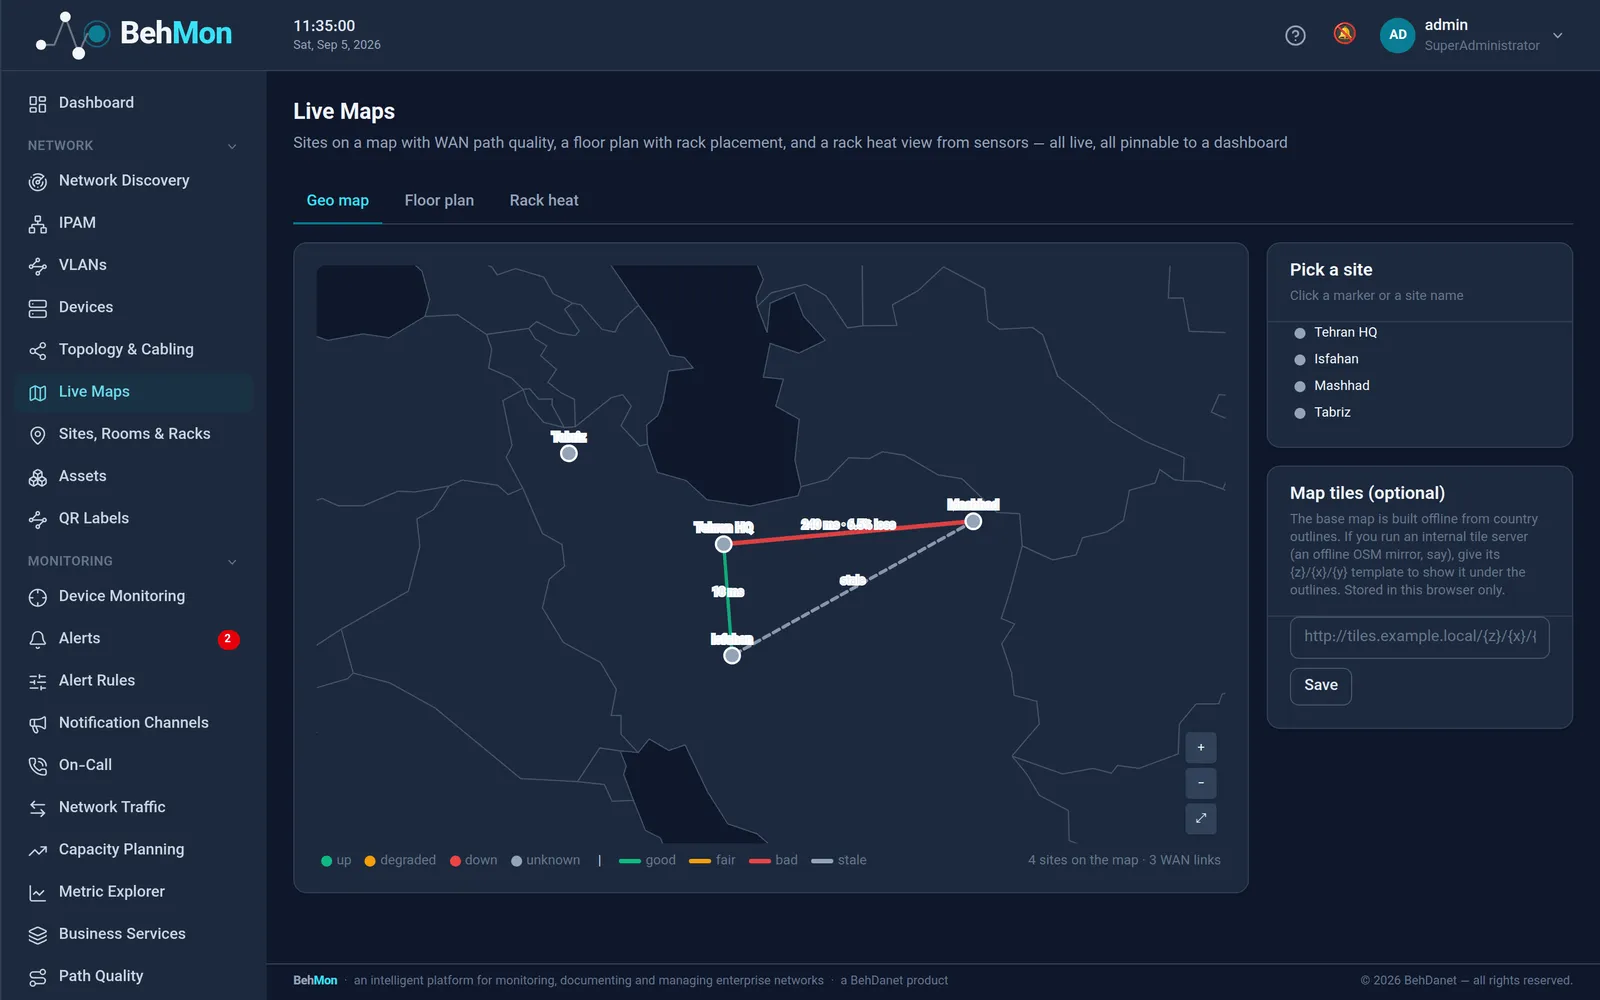
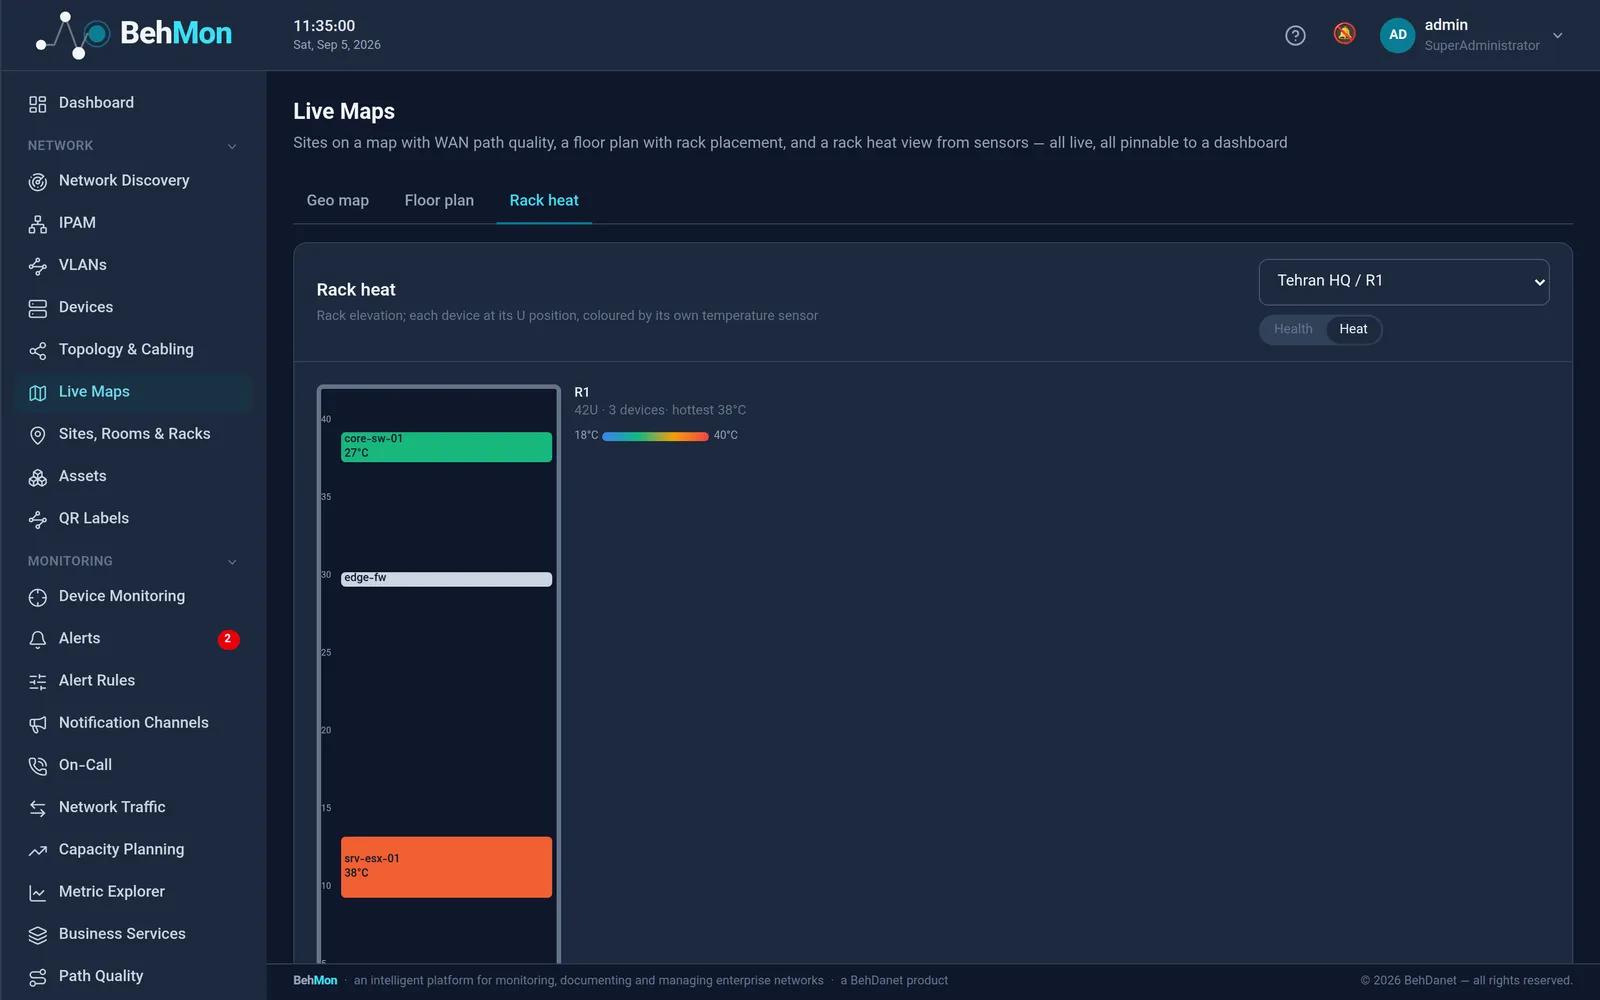
  • Geographic site map, floor plans and rack heat maps

Scale, availability, and watching the platform itself

For large networks several instances of each service run side by side and share the polling — and the platform reports on its own health too.

  • Run a service twice: every background pass runs on exactly one instance, and a dead leader hands the work to the next
  • Targets split between pollers, so an instance joining or leaving moves only its own share
  • A Postgres replica that carries the heavy queries, with its lag visible in the panel
  • Distributed tracing (W3C): one trace id finds a request in every service's log
  • A platform SLO with its error budget, and a provisioned Prometheus/Grafana dashboard
  • Rolling upgrades in working hours: the new instance is healthy before the old one is drained

Frequently asked questions

Which devices does BehMon support?

Anything that answers ping, TCP or SNMP — which in practice means switches, routers, firewalls, servers, UPSs and storage from vendors such as Cisco, MikroTik, HPE/Aruba, Huawei, Fortinet and Dell. Web services, DNS and TLS certificates are checked directly.

Do we need to install anything on our devices?

No. Network devices are monitored over SNMP and ping. The agent is optional and only for servers (when you want CPU and disk) or probes inside branches.

How are alerts delivered?

Email, SMS through local providers, messengers, webhooks, syslog/CEF for a SIEM, and browser and mobile push notifications — each channel with its own quiet hours and message template.

See your own network in BehMon

Book an online demo, or install the 30-day trial on your own server. Our engineers will be right there with you.